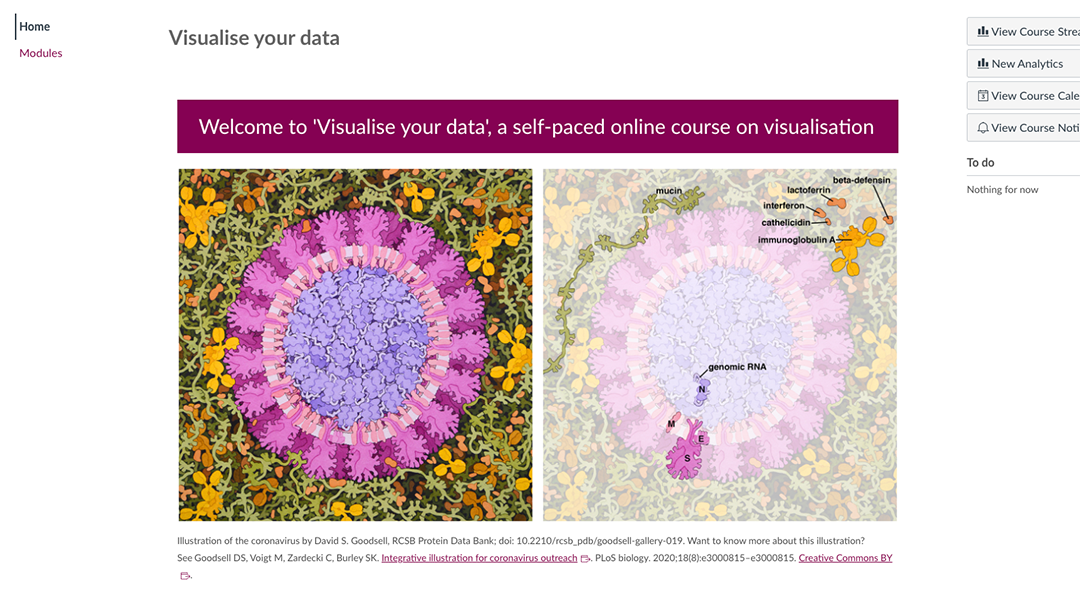
Visualising data

Visualisation of biological data is a rapidly expanding multidisciplinary field. Here you'll find information and valuable resources that will hopefully aid you in creating your own visual content.

Image by Dr. Jan Krivanek, Igor Adameyko Lab

Visualisation
Visualisation
A viualised virus

Visualisation

An introduction to the basics of visualising biological data. The concept can actually include everything from exploratory diagnostics to explanatory popular science, but here we have chosen to focus on the communicative component, while taking into account the broader concept.

Principles of design

Principles of design

A central tool in data visualisation is the mobilisation of human perceptual abilities in order to better understand a given data base. This is something that, in turn, is served by a certain basic understanding of human perception.

Colour
Colour
Colour wheel

Colour

Graphical abstracts

Graphical abstracts

Being able to create a visual summary of the key findings of an article is becoming more and more important. The summary is usually comprised of a single image designed to help the reader to quickly identify the relevance of the written material.

Accessible visualisation

Accessible visualisation

Visual scientific communication needs to be both accessible and have a clear and transparent connection to the underlying science.